
Every week I use TradingView with a custom Indicator to only show the UK trading hours to day trading CAC 40. I use this to determine
- Trend Days
- Monday – Wednesday Pattern
- Monday High of the week
- Friday Higher than Thursday
This gives me an idea into how the following week will perform, by going thru historic weeks and spotting patterns. *The blue line is a 20 EMA moving average
Day Trading CAC 40 Ideas
I have not provided any information in how I use these charts in my day trading and they may seem to absolute no use, but I use it for scenarios in the week.
I ask myself the question pre market Wednesday: “IF Tuesday didnt breaks the highs of Monday.. then whats in store for Wednesday?”.
I know look at historic weekly UK session charts and see any patterns for Wednesday. All this is based off Tom Hougaards research.
5th – 9th June 2023

29th May – 2nd June 2023

15th – 19th May 2023
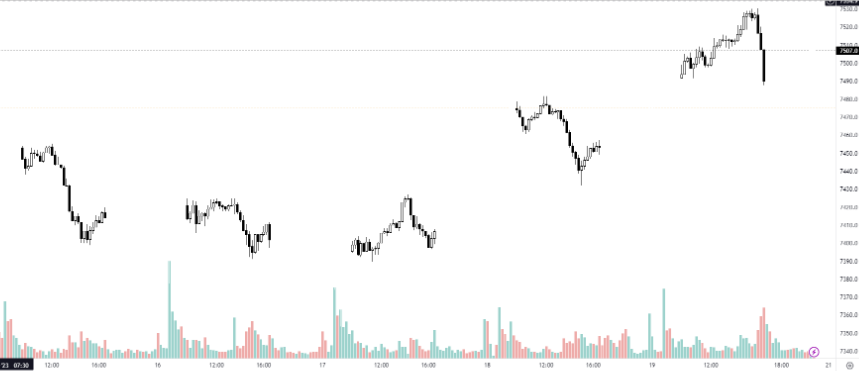
I use TradingView for my charting, I am on a PRO account which gives me extra 5 minute candle past data.