
Quick links
NOTE: The winning and losing chart examples are from my actual trades. I don’t look at past charts to find the 2 bar bear reversal examples. I take screen shots as they ACTUALLY happen, regardless if the trade is Win or Lose.
Understanding the 2 Bar Bear Reversal Pattern
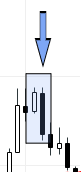
The “2 Bar Bear Reversal Pattern” is a candlestick pattern commonly used in technical analysis to identify potential reversals in a bullish trend. This pattern is characterized by two consecutive bars (candlesticks) that indicate a potential shift from a bullish to a bearish trend. Here’s how you can trade this pattern, along with suggested entry, take profit, and stop-loss levels:
Pattern Description:
The 2 Bar Bear Reversal Pattern consists of two consecutive candlesticks.
Candlestick Characteristics:
- First Candlestick: The first candlestick is a bullish (up) candlestick that closes near its high, indicating a strong bullish sentiment.
- Second Candlestick: The second candlestick is a bearish (down) candlestick that opens above the close of the first candlestick but closes below the midpoint of the first candlestick’s body. This signifies a potential shift in sentiment from bullish to bearish.
Implementation of the trading Strategy:
- Recognition:
Identify the 2 Bar Bear Reversal Pattern on the price chart. Look for a clear first bullish candlestick followed by a second bearish candlestick that meets the criteria mentioned above. - Entry:
Enter a short trade when the conditions of the 2 Bar Bear Reversal Pattern are met:
Wait for the second bearish candlestick to close. Enter a short position (sell) at the opening price of the candlestick following the second bearish candlestick. - Stop-Loss:
Place a stop-loss order above the high of the second bearish candlestick. This level acts as a potential resistance point. Placing the stop-loss above this point helps protect your capital in case the reversal doesn’t materialize and the bullish trend resumes. - Take Profit:
There are a few ways to set a take-profit level:
Option 1: Set a take-profit target based on a key support level or a previous swing low. Option 2: Use a trailing stop to capture profits as the price moves in your favor. Option 3: If you’re using technical indicators, consider using them to identify potential support levels for taking profits.
Winning Trade Chart Examples
The below winning examples are from actual trades I placed and recent. The charts below have NOT been trawled for looking at old charts, I take screen shots as the 2 bar bear reversal occurs, regardless of success or failure of the trade.


Losing Trade Pattern Chart Examples


The 2 bar bull reversal charts are from my live broker TD365, create a demo account.